Scraping Smart Plugs and Graphing the Data in NewRelic
Note: This post was originally posted on my personal blog. I have copied the content to this blog.
Now, how did I do it?
First I purchased a few smart plugs. I got 3 Kasa KP115, which are very reasonably priced.
Then I set the smart plugs up on my network like normal using the app (and upgraded the firmware, which will cause a brief outage when it resets).
After that, it was time to get to hackin’!
I found a good scraping tool at https://github.com/Zibby/tplink-exporter/ which has a Docker image and is compatible with my plugs (it is compatible with a few different kinds of TP-Link plugs). Then I wrote a helm chart to deploy that image via my already existing Flux installation. Then I made a HelmRelease (a Flux Custom Resource Definition) to add values to point the chart at my plugs.
Then I followed New Relic’s instructions on scraping and ingesting Prometheus metrics. Here’s my final YAML. Note the extreme filtering (I don’t wanna pay for data I won’t look at).
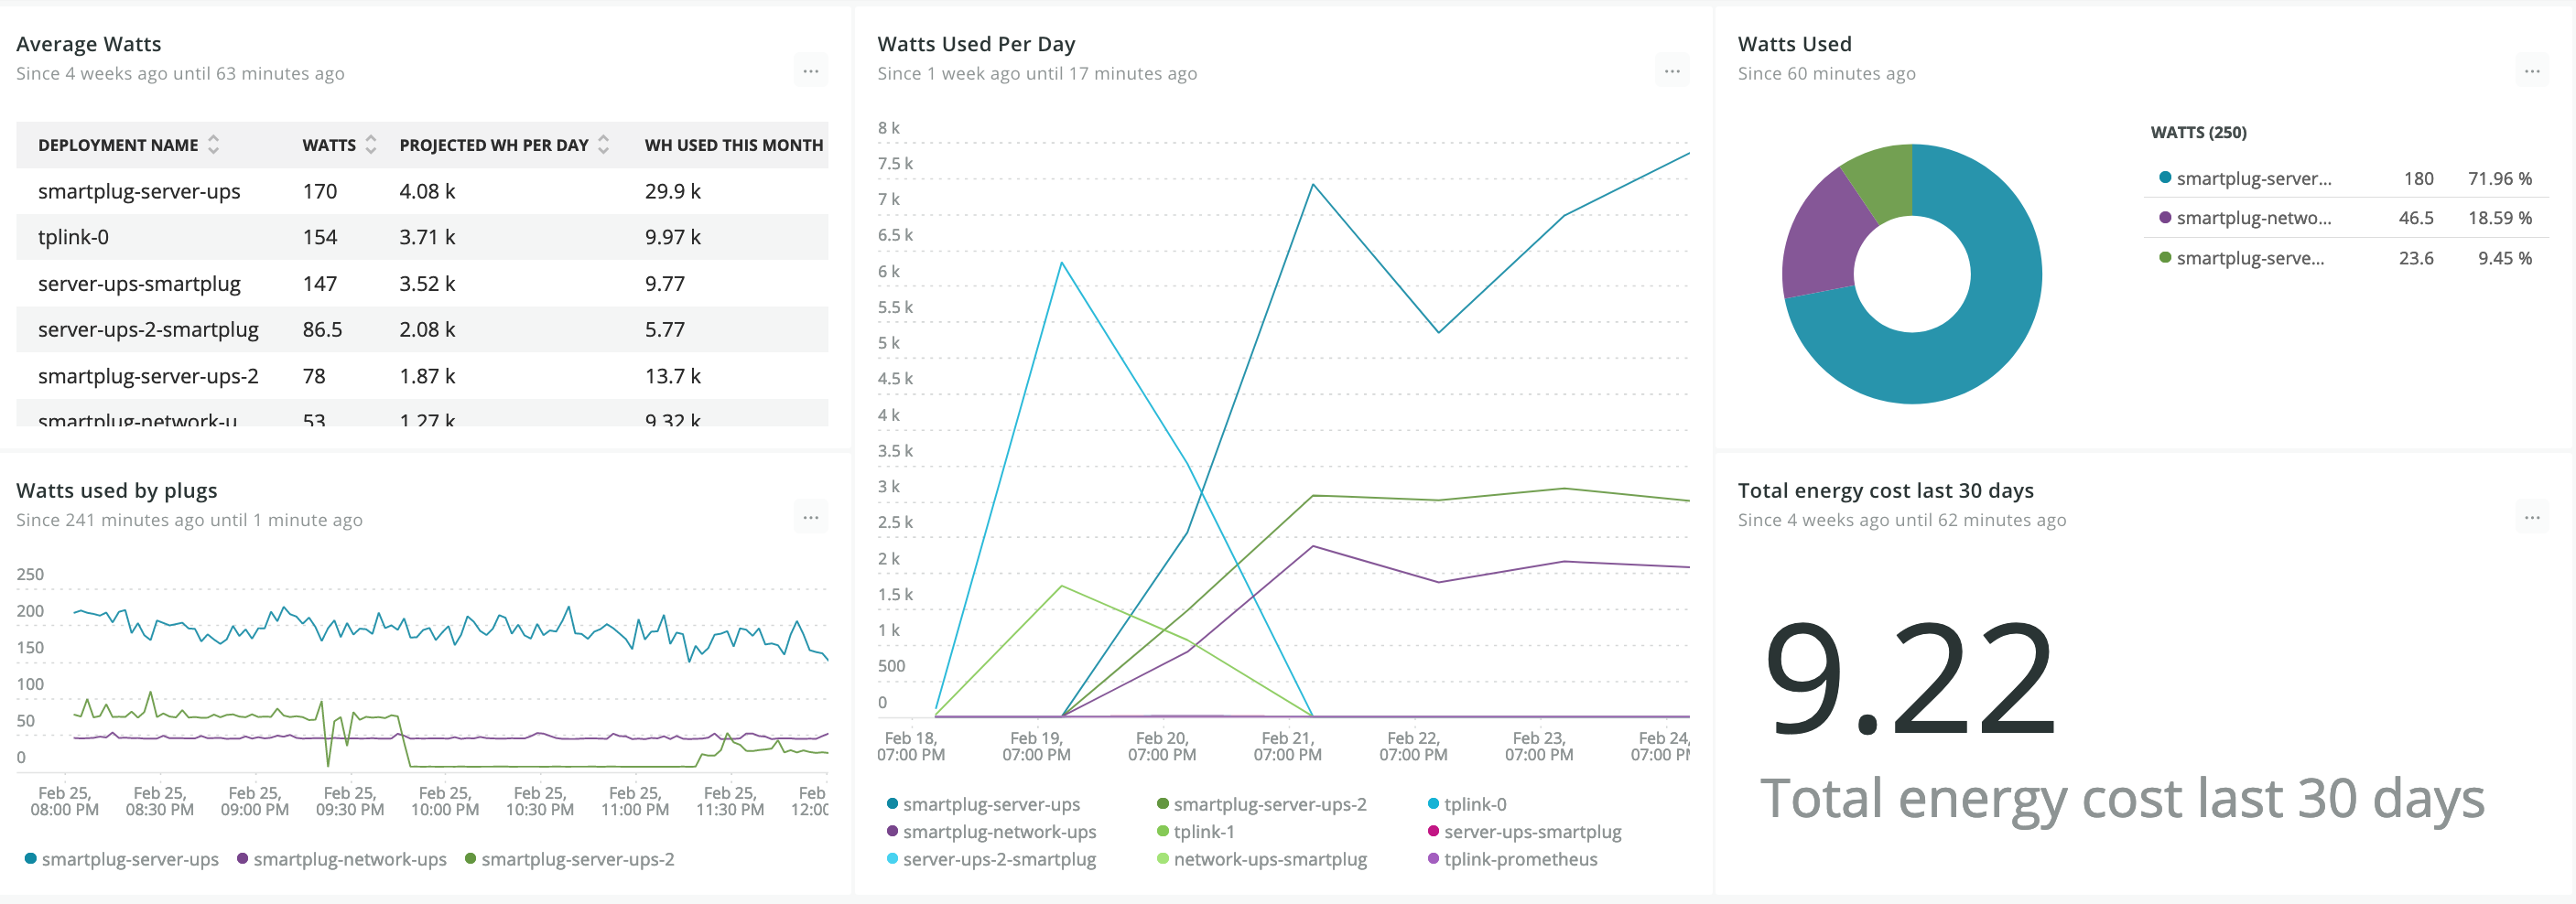
Finally I built some dashboards. This part I did manually so there’s no code to look at, but here’s the NRQL from the “Watts used by plugs” chart:
FROM Metric SELECT average(kasa_power) as 'Watts' FACET deploymentName TIMESERIES 2 minutes since 4 hours ago
Note the 2 minutes there; I’m not sure why but it actually takes 60 seconds for tplink-exporter to return data (even though the smartphone app updates about once every 2 seconds). It doesn’t really bother me as I don’t need 1 minute granularity so I just relaxed the timeouts.
And that’s it! It took longer than it seems, mostly because I got stuck with the Prometheus stuff (timeouts, how to get Open Metrics to scrape the deployment).

